This weekend I’ve been poking around in OED3’s etymologies, and it occurred to me that an interesting thing might be lay out all English words according to when they are first attested, and what language they come from. This morning I made a bunch of graphs, below.
Before having a look, it’s worth mentioning that etymology can mean different things, and even with an agreed definition, they can be complex. For one thing, a word can have more than one etymon. To give a simple example, a word like machine comes into English from French, but is traceable back to Latin, and then Greek. Slightly less intuitive is OED3’s etymology for mesotrophic, which you might say is transparently Greek, but OED describes as an English compound, formed on a German model. It doesn’t even mention Greek, referring us instead to meso- and -trophic, two productive English particles with Greek etymons.
In the charts below, I’m using OED3’s narrow definition of etymon, which in most cases corresponds to the most recent donor language: e.g. French for machine, and English for mesotrophic. There are a small number of words that do have two etymons, if the donor language is unclear, or the word is independently borrowed from two languages: medicament, the noun, is either a borrowing from French or a borrowing from Latin; by contrast, the later medicament, used briefly as a verb, has just an English etymon, since it’s based on the English noun.
This phenomenon accounts for the dominance and resilience of English as the main source language of new English words (figs. 1, 2, 3). Note that the rate of new word attestation in OED3 produces the famous “double hump” curve, with a big dip in the 18thC. This is either because not a lot of new words were being made up in the 1700s, or there weren’t as many books being produced, or the OED folks assigned to work on the century dropped the ball (this did happen, as Charlotte Brewer has discussed). Also note that in every graph I give a rolling 100y total, so that the figure for, say, 1866, represents the sum of all words first attested 1767-1866 (divide by 100 for the average for that period). Two other caveats: totals after 1900 can’t really be compared to the rest of the graph because of the chronology of the making of the OED, and averages before about 1300 are sketchy, due to the small numbers involved.
Okay, so:
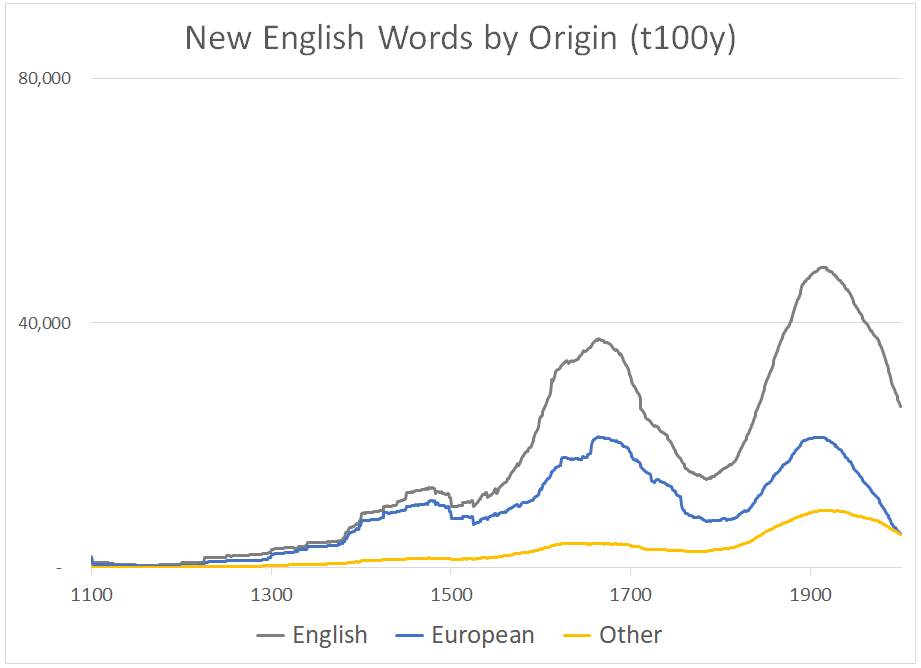
Figure 3 – Area chart showing % per source.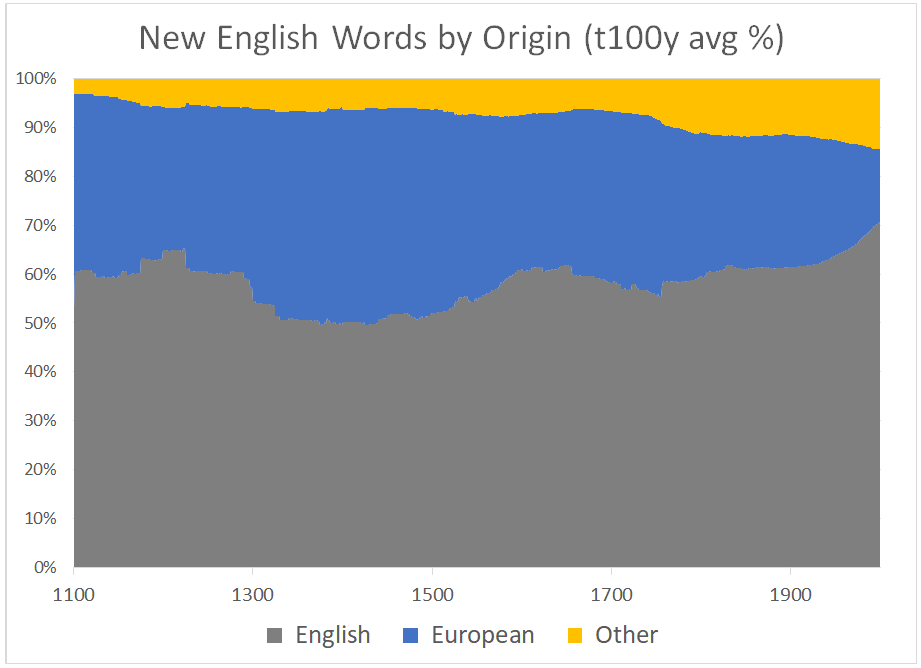 The final chart is perhaps the most telling, since it smooths out the variable rate of word production. A couple things to note: (1) we see here a steadily increasing contribution from non-European languages over time, which makes sense; (2) the contribution from European languages decreases over time; (3) the contribution from English tends to go down and then recover, go down and recover: I believe this is the combined effect of contact events (Norman conquest, Renaissance, British imperial expansion) and the propensity, noted above, for language to build on itself. What was hard to see in Figure 1 is much plainer here: the European contribution, in proportional terms, peaks in the period between 1300 and 1500. There is also a small uptick before 1750.
Let’s take a closer look at these European donor languages. It won’t be surprising that Latin and French dominate (Latin would be higher if so many Latin words hadn’t passed through French; Greek higher if so many hadn’t passed through Latin). Again, though, I think the real story gets told in Fig. 5, where we see French cutting deeply into Germanic in the earliest couple of centuries, as Norman vocabulary filters into the general language, and then the written record, with the balance swinging to Latin beginning in the early Renaissance, as classically-minded authors in the arts as much as the sciences begin to circumvent the transmission language to borrow straight from the source:
Figure 4. Figure 5.
  Finally, a closer look at that thin but expanding slice of Figure 3, those words that English gets from non-European languages. I start the graph at 1600 here because the numbers for non-Middle-Eastern languages are too small to be interesting. The comparatively large (though still small) number of Middle Eastern words from before 1600 tend to be Arabic (muezzin, Ramadan, giraffe, henna, hashish) Persian (bazaar, divan, dervish, turban) or Hebrew (Eden, Talmud, rabbi, sheol, shibboleth).
Figure 6.
 Naturally, what we see in the middle of the graph is a story of Empire, with the ascendency of words from every continent colonized by the British. After 1750 the number of non-European loanwords rises dramatically, as does the percentage of new words from these languages (though less dramatically – see fig. 3). Languages of the Indian subcontinent are far and away the most numerous, contributing almost a third (29%) of words from non-European sources between 1770 and 1900, which works out to about 4% of the total from European (non-English) sources). According to OED’s word-frequency data, the most commonly used of these are Hindu (1655), Shri (1799), Brahmin (1481), jungle (1776), Sanskrit (1617), and Sikh (1781).
The Austronesian group includes Hawaiian, Malay, Tagalog, and Javanese, but the most words come from Maori, an indication perhaps of the interests and/or resources available to New Zealander Robert Burchfield, editor of the Second Supplement. Not that I would begrudge the dictionary these words, much less the language, but it does seem that 287 Maori words is somewhat out of proportion compared to, say, 179 indigenous Australian words, or even 539 indigenous American words (see my previous post, which used OED2 data) or 522 indigenous African words, considering (A) the population and linguistic diversity of America and Africa compared to New Zealand, and (B) the history of contact with English speaking people – Cook’s voyage was not till 1769.
The most frequent words from each of these regional groupings are in most cases proper names describing peoples (e.g. Maori, Cherokee) but putting these aside, the most frequent non-proper-name words are listed as, in descending order: African – chimpanzee (1738, 2.5 wpm); American – moose (1614, 1.4 words per million); Australian – kangaroo (1773, 1.1 wpm). Maori is tough to gauge because the frequencies for words such as ne, mai, pa, para, rata, ko, kai, tuna and so on are likely to be contaminated in the Google Books corpus (on which OED frequencies are based) by non-Maori occurrences of those character strings. The first one I can be reasonably certain of is (you guessed it) kiwi (1835, 0.23 wpm). Compare Hindi jungle, at 7.5 wpm.
Here are the same tallies in a proportional area chart:
Figure 7.
 One thing that puzzles me is why (East) Asian words continue to increase in number (fig. 6), and therefore proportion (fig.7) well after OED3’s structural peak around 1900, when the total number of quotations begins to decline (see Fig. 1). The words in this late bracket are mostly either Chinese or Japanese in origin, and include gyoza (1965), won ton (1948), goji (2002), and emoji (1997). Other languages give bibimbap (Korean – 1977) banh mi (Vietnamese – 1997) and phad thai (Thai – 1978). Could menus be the biggest driver, I wonder?!
One last short list, picked from the (not superbly reliable) word frequency data in OED3. The 5 most-common English words of non-English, non-European origin are: Muslim (1626 – 41 wmp), China (1555, 34 wpm), coffee (1598, fr. Arabic, 29 wpm), Hindu (1655 – 23 wpm).
[I know, I know, you’re all like, “Cherokee? (think Jeep Grand…) what about tomato and chocolate? … What about tank, orange, and pepper? What about sugar, magazine, zero, taboo…. Yep, these are all very common English words with non-European origins. But in every case they got into English via a European language, so would have to be part of another kind of analysis].
No Comments